


UK inflation has moved higher again, but the latest data show that the story is changing.
The Consumer Prices Index (CPI) rose by 2.9% in the 12 months to July 2026, up from 2.6% in June, according to the Office for National Statistics (ONS). CPIH, which includes owner-occupiers’ housing costs, rose by 3.1%.
The important question is no longer simply why prices are rising. It is which prices are rising fastest — and how persistent those pressures are likely to be.
Energy has become a major source of pressure again. Housing costs remain elevated, services inflation is still above the level consistent with the Bank of England’s 2% target, and businesses continue to face higher input costs. At the same time, food inflation has eased considerably.
The result is a UK inflation picture that is more complicated than the headline 2.9% figure suggests.
Key Facts
- UK CPI inflation was 2.9% in July 2026, up from 2.6% in June.
- CPIH inflation was 3.1%.
- Core CPI was 2.6%.
- Services inflation was 3.4%.
- Food inflation was only 1.3%.
- Housing and household services inflation was 4.1%.
- UK private rents rose 3.7% year-on-year in July.
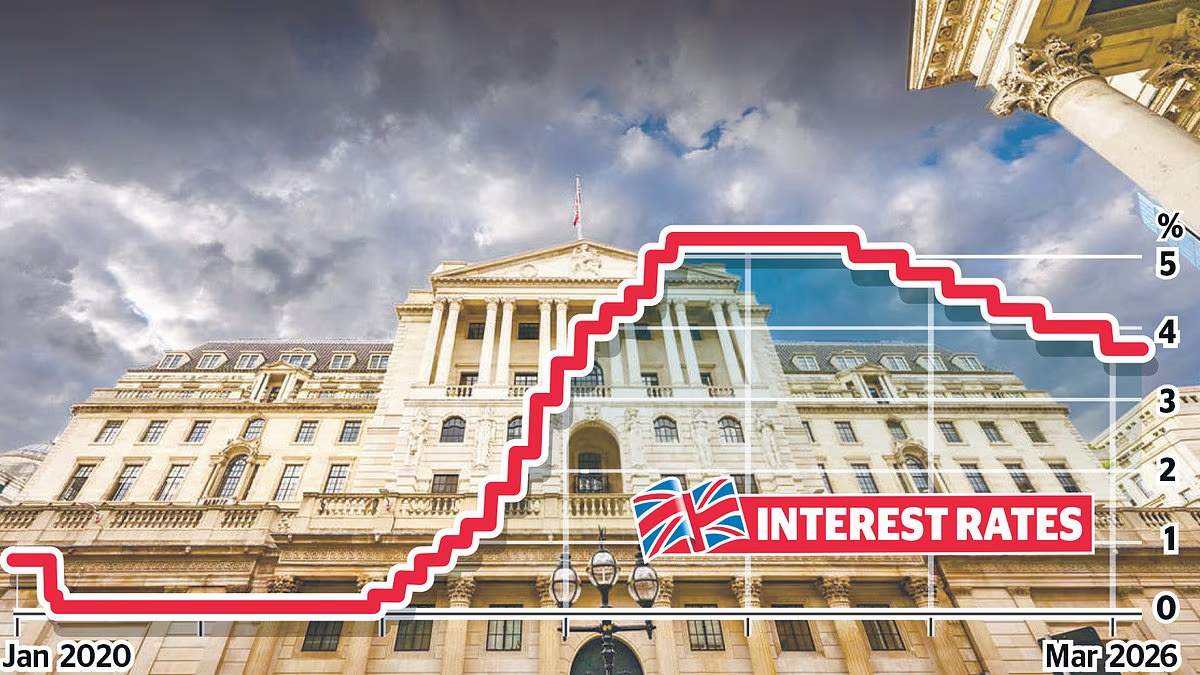
- The Bank of England’s Bank Rate is 3.75%.
- Ofgem’s energy price cap will rise by 4% from October for a typical household on a default tariff paying by Direct Debit.
- Ireland’s August 2026 flash HICP inflation estimate was 3.4%, providing a useful regional comparison.
Table of Contents
- What happened to UK inflation?
- What is driving UK inflation in 2026?
- Are energy prices the biggest problem?
- Is food inflation still driving prices?
- Why are services prices still rising?
- What role are wages playing?
- Are rents adding to inflation?
- How are businesses being affected?
- What does inflation mean for UK households?
- What does it mean for interest rates?
- How does UK inflation compare with Ireland?
- What happens next?
What Happened to UK Inflation?
UK CPI inflation increased to 2.9% in July 2026 from 2.6% in June.
It was the first increase in the annual inflation rate since March.
CPIH also increased, reaching 3.1% in July compared with 2.8% in June.
The distinction matters because CPI and CPIH measure prices differently. CPI is the main measure used for the UK’s monetary-policy inflation target, while CPIH incorporates owner-occupiers’ housing costs and is the ONS’s broader measure of household inflation.
The next major update will be the ONS August CPI release on 16 September 2026.
That figure will arrive just before the Bank of England’s scheduled September monetary-policy meeting.
What Is Driving UK Inflation in 2026?
The current inflation picture has several components.
The most important are:
- energy;
- housing and household costs;
- services;
- transport and fuel;
- business input costs;
- global supply pressures.
Food, by contrast, has become a much smaller part of the inflation story.
UK inflation by major category
| Category | Annual inflation, July 2026 |
|---|---|
| Headline CPI | 2.9% |
| Core CPI | 2.6% |
| Food | 1.3% |
| Housing and household services | 4.1% |
| Services | 3.4% |
| Goods | 2.2% |
Source: ONS.
This makes the current inflation environment very different from the period when supermarket prices dominated the cost-of-living debate.
Are Energy Prices the Biggest Problem?
Energy is one of the most important reasons inflation risks remain elevated.
The Bank of England has repeatedly highlighted the effects of higher global energy prices on the UK economy. Energy affects households directly through electricity, gas and motor fuel, but it also affects businesses because energy is an input into manufacturing, transport, hospitality, food production and other services.
That second effect is particularly important.
A company facing higher energy and transport costs has several choices. It can absorb the increase through lower profit margins, reduce costs, cut production or pass some of the increase to customers.
If enough businesses raise prices, an external energy shock can begin appearing across a much wider range of consumer prices.
October energy bills are an important test
Ofgem has announced a 4% increase in the energy price cap from 1 October to 31 December 2026 for a typical household using electricity and gas and paying by Direct Debit.
The October rates include an average electricity unit rate of 26.32p per kWh and a gas unit rate of 7.97p per kWh for households covered by the default tariff cap.
The government is also removing VAT from electricity bills between October 2026 and March 2027. That means the headline movement in the cap does not translate directly into an identical change in every household’s bill. Actual costs depend on consumption, region, tariff and meter type.
Nevertheless, the increase demonstrates why energy remains a significant inflation risk.
Is Food Inflation Still Driving Prices?
Not to the same extent.
Food and non-alcoholic beverage inflation was 1.3% in July, down from 1.7% in June. The House of Commons Library described July’s food inflation rate as the lowest since August 2024.
That is an important change.
During the earlier cost-of-living crisis, food-price increases were among the most visible pressures on households. In 2026, the latest data suggest that food is no longer the dominant source of UK inflation.
Competition between supermarkets and pressure on consumers have also limited the extent to which businesses can pass every increase in their costs to shoppers.
However, food remains vulnerable to energy, transport, fertiliser and international commodity costs.
That means low food inflation should not be interpreted as a guarantee that food prices will remain subdued.
Why Are Services Prices Still Rising?
Services inflation is one of the most closely watched indicators for the Bank of England.
CPI services inflation was 3.4% in July, compared with goods inflation of 2.2%.
Services prices are important because they are generally more closely connected to domestic costs such as wages, rents and business overheads.
A fall in services inflation would therefore provide stronger evidence that underlying domestic inflationary pressure is easing.
The July figure shows progress compared with the exceptionally high services inflation recorded during the earlier inflation shock, but it remains above the 2% headline target.
What Role Are Wages Playing?
Wage growth has slowed considerably compared with the strongest period of post-pandemic labour-market pressure.
ONS reported that regular average earnings in Great Britain increased by 3.5% year-on-year in April to June 2026.
Total earnings, including bonuses, increased by 4.1%.
When adjusted using CPI, real regular pay increased by 0.7%.
The private sector recorded regular earnings growth of 2.8%, compared with 6.1% in the public sector. The ONS cautions that public-sector figures are affected by the timing of pay awards.
This is one reason the current inflation environment should not be described as a straightforward wage-price spiral.
The labour market has also weakened. ONS reported a UK unemployment rate of 4.9% for April to June 2026, while payrolled employees fell by 78,000 between June 2025 and June 2026.
The combination of slower private-sector wage growth and a softer labour market should help reduce persistent domestic inflation pressure over time.
Are Rents Adding to Inflation?
Yes.
Private rents increased 3.7% in the 12 months to July 2026, with the average UK monthly rent reaching £1,393.
England’s average rent was £1,451, while Wales recorded £843 and Scotland £1,016.
Rental inflation varies significantly between regions. In England, the North East recorded annual rental inflation of 6.3% in July, compared with 3.0% in London.
Housing therefore remains an important part of the household inflation story.
For renters, the impact can be much greater than the national CPI figure suggests because housing is a large proportion of monthly household spending.
How Are Businesses Being Affected?
Businesses are facing a difficult combination of elevated costs and relatively cautious consumer demand.
ONS producer-price data showed producer input prices rising 4.9% in the year to July, while factory-gate output prices increased 3.1%.
Businesses can absorb some of those costs, but not indefinitely.
The consequences can include:
- higher prices;
- lower margins;
- reduced hiring;
- lower investment;
- supply-chain changes;
- productivity investment;
- greater automation.
This is particularly relevant to smaller businesses, which may have less purchasing power and smaller profit margins than large corporations.
Is AI Adding to Inflation?
AI is becoming an unusual part of the inflation story.
The Bank of England has identified strong global demand for AI-related components as a source of sector-specific price pressure feeding into UK import prices.
The effect is particularly relevant to electronics and technology products.
The broader economic picture is more complicated, however.
AI can raise demand for scarce components and infrastructure in the short term, potentially increasing prices. At the same time, AI-driven productivity improvements could reduce costs over the longer term.
For UK businesses, the inflation impact of AI is therefore likely to differ significantly by industry.
What Does UK Inflation Mean for Households?
The headline 2.9% figure does not mean every household is experiencing a 2.9% increase in its personal cost of living.
Households spend money differently.
A renter facing a rent increase, higher energy bills and transport costs could experience much stronger cost pressure than a household with a mortgage-free home and low energy consumption.
The ONS’s Household Costs Indices are designed to provide additional information about how inflation affects different household groups.
This distinction is important because personal inflation can differ materially from headline CPI inflation.
What Does Inflation Mean for Interest Rates?
Inflation is central to the Bank of England’s interest-rate decisions.
Bank Rate currently stands at 3.75%. The Bank held it at that level in July and said that higher and volatile energy prices could cause inflation to rise again later in 2026.
The Bank faces a difficult balance.
Keeping rates higher for longer can help prevent inflation from becoming persistent, but high borrowing costs can also weaken household spending, investment and housing activity.
The next major data point is August CPI, due on 16 September.
The next MPC decision is scheduled for 17 September.
That makes September one of the most important months of the year for UK inflation watchers.
How Does UK Inflation Compare With Ireland?
Ireland’s latest flash HICP estimate provides an interesting comparison.
The CSO estimated that Irish HICP inflation reached 3.4% in August 2026, up from 3.1% in July.
Energy prices were estimated to have risen 11.8% over the year, while services inflation was 3.7%. Food prices increased only 0.1%.
The UK and Ireland use different statistical measures for some headline comparisons, so these figures should not be treated as perfectly identical measures.
Nevertheless, both countries illustrate the same broader European issue: energy and services remain important inflation risks even as food-price inflation becomes less intense.
What Are Investors Watching?
Investors are likely to focus on five issues.
1. August CPI
The September 16 ONS release will provide the first official August inflation reading.
2. Energy prices
Higher wholesale energy prices could feed through into household bills and business costs.
3. Services inflation
Persistent services inflation would make it harder for the Bank of England to declare the inflation problem solved.
4. Wage growth
A continued slowdown in private-sector wage growth would support the case for lower underlying inflation pressure.
5. Bank Rate
The central question is whether inflation is temporary enough for the Bank to tolerate it or persistent enough to require a tighter policy stance.
What Happens Next?
The immediate timeline is clear.
2 September 2026: latest available data are still based on July UK CPI.
16 September: ONS publishes August 2026 CPI.
17 September: Bank of England MPC decision.
1 October: new Ofgem energy price cap takes effect.
28 October: UK Budget is scheduled, adding another major fiscal-policy event to the inflation outlook.
The critical question is whether higher energy costs remain a temporary external shock or begin producing broader and more persistent domestic inflation.
The evidence so far points in both directions.
Food inflation has eased. Wage growth has slowed. The labour market has softened.
But energy, housing and services remain sources of pressure.
The Bottom Line
UK inflation in 2026 is not simply a story of supermarkets charging more.
The latest data show a more complicated picture.
CPI inflation has risen to 2.9%, but food inflation has fallen to 1.3%. Instead, housing and household services, energy-related costs and services inflation are playing a much greater role.
The October energy-price-cap increase means households and businesses face another important test, while the September inflation release will give the Bank of England a clearer indication of whether price pressures are accelerating or stabilising.
For households, the headline CPI rate remains only part of the story. For businesses, the key issue is whether higher input costs can be absorbed without creating another wave of consumer price increases.
And for investors, the central question remains the same:
Can UK inflation return sustainably to 2% without the Bank of England having to keep interest rates higher for longer?
Key facts
- UK CPI: 2.9%, July 2026.
- CPIH: 3.1%.
- Core CPI: 2.6%.
- Services: 3.4%.
- Food: 1.3%.
- Housing/household services: 4.1%.
- Regular earnings growth: 3.5%.
- Private-sector regular earnings growth: 2.8%.
- UK private rents: +3.7%.
- Bank Rate: 3.75%.
- October energy cap: +4% for a typical default-tariff household.
- Ireland August flash HICP: 3.4%.
Key takeaway
The UK’s inflation problem in 2026 is increasingly an energy, housing and services story rather than a food-price story.
FAQ SECTION
1. What is UK inflation in 2026?
UK CPI inflation was 2.9% in July 2026, up from 2.6% in June.
2. Why is UK inflation rising?
Energy costs, housing and household services, transport and persistent services inflation are among the main pressures keeping UK inflation above the Bank of England’s 2% target.
3. Is food causing UK inflation in 2026?
Food is no longer the dominant inflation driver. Food inflation was 1.3% in July 2026.
4. Are energy prices pushing up UK inflation?
Yes. Higher global energy prices affect household utility bills and fuel costs directly and can also raise business and supply-chain costs.
5. Will UK inflation fall in 2026?
The Bank of England expects inflation to rise again in the near term before gradually moving back towards its 2% target, but the path remains uncertain because of energy prices and other external risks.
6. What is the Bank of England interest rate?
Bank Rate is currently 3.75%. The next scheduled MPC decision is on 17 September 2026.
7. Are wages still driving UK inflation?
Wage growth has slowed. Regular average earnings increased 3.5% year-on-year in April-June 2026, while private-sector regular earnings growth was 2.8%.
8. How much are UK rents rising?
Average UK private rents increased 3.7% year-on-year in July 2026 to £1,393 per month.
9. When will the next UK inflation figure be released?
ONS is scheduled to publish August 2026 CPI on 16 September 2026.
10. How does UK inflation compare with Ireland?
Ireland’s August 2026 flash HICP estimate was 3.4%, compared with UK CPI inflation of 2.9% in July. The measures should not be treated as perfectly identical, but the comparison provides useful regional context.
